Aug. 15, 2016 | CREBNow
National homes sales post third consecutive decline
Prices exhibit resilience, record biggest gain since 2006
National home sales declined for a third consecutive month in July, according to statistics released today by the Canadian Real Estate Association (CREA).
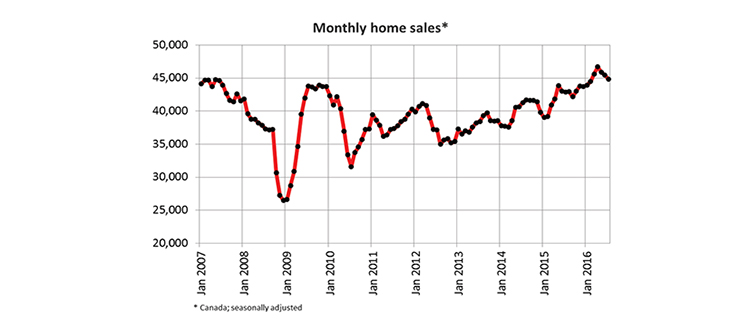
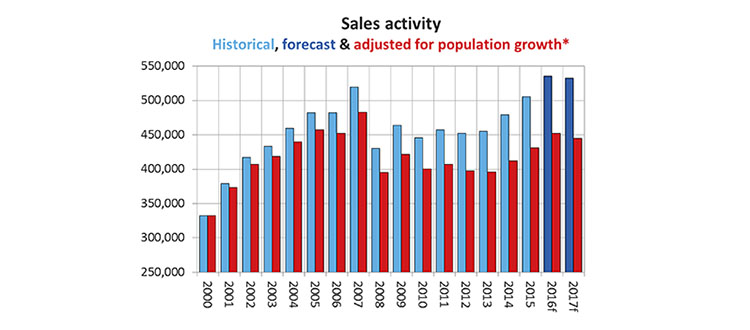
The number of homes trading hands via Canadian MLS® Systems fell by 1.3 per cent month-over-month in July 2016. With similar monthly declines having been posted in May and June, national sales activity in July came in 3.9 per cent below the record set in April 2016. (Chart A)
Sales activity was down from the previous month in slightly more than half of all markets in July, led by Greater Vancouver and B.C.'s Fraser Valley. Transactions in these two markets peaked in February of this year, and have since then dropped by 21.5 and 28.8 percent respectively.
Accordingly, much of the national sales decline in recent months reflects slowing activity in B.C.'s Lower Mainland.
"National sales and price trends continue to be heavily influenced by a handful of places in Ontario and British Columbia and mask significant variations in local housing market trends and conditions across Canada," said CREA president Cliff Iverson. "All real estate is local, and REALTORS® remain your best source for information about sales, listing and price trends where you live or might like to in the future."
CREA chief economist Gregory Klump signaled out B.C.'s lower mainland, where home sales continued to trend lower while price gains further accelerated.
"This suggests that sales are being reined in by a lack of inventory and a further deterioration in affordability," he said. The new 15 per cent property transfer tax on Metro Vancouver home purchases by foreign buyers took effect on August 2nd, so it will take some time before the effect of the new tax on sales and prices can be observed. That said, the new tax will do little in the short term to increase the supply of homes."
Actual (not seasonally adjusted) sales activity was down 2.9 per cent year-over-year in July 2016, marking the first year-over-year decline since January 2015 and the largest since April 2013.
In line with softening activity in the Lower Mainland, year-over-year increases have been losing momentum since February 2016. Sales were down from levels one year earlier in about 60 per cent of all Canadian markets, led by Greater Vancouver, the Fraser Valley, Calgary and Edmonton.
The number of newly listed homes rose by 1.2 per cent in July 2016 compared to June. While new supply climbed in fewer than half of all local markets, increases in Greater Vancouver and the Fraser Valley, Greater Toronto, Calgary and Edmonton outweighed declines in smaller markets.
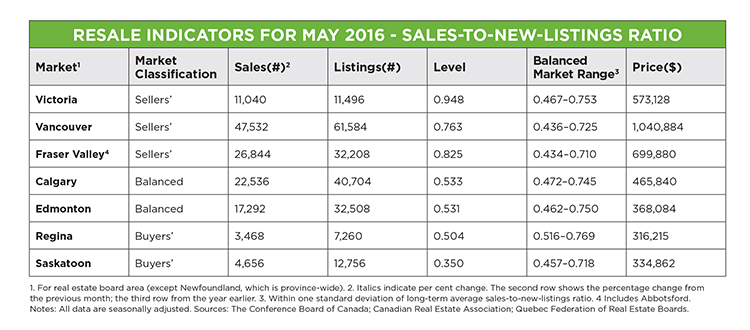
With sales down and new listings up, the national sales-to-new listings ratio eased to 61.6 per cent in July 2016 – its second monthly decline following its peak of 65.3 per cent in May. A sales-to-new listings ratio between 40 and
60 per cent is generally consistent with balanced housing market conditions, with readings below and above this range indicating buyers' and sellers' markets respectively, noted CREA. The ratio was above 60 per cent in about half of all local housing markets in July, virtually all of which continue to be located in B.C., in and around the Greater Toronto Area and across southwestern Ontario.
The national home price index, meanwhile, rose by 14.3 per cent in July 2016, the biggest gain since November 2006. For the sixth consecutive month, CREA reported the year-over-year price growth accelerated for all benchmark property types tracked by the index.
Two-storey single family home prices continued to post the biggest gain (15.9 per cent), followed by townhouse/row units (15.3 per cent), one-storey single family homes (14.3 per cent) and apartment units (11.1 per cent).
While prices in nine of the 11 markets tracked by the MLS® HPI posted year-over-year gains in July, increases continue to vary widely among housing markets. Greater Vancouver (32.6 per cent) and the Fraser Valley (37.6 per cent) posted the largest year-over-year gains by a wide margin, followed by Greater Toronto (16.7 per cent), Victoria (17.5 per cent) and Vancouver Island (11.6 per cent).
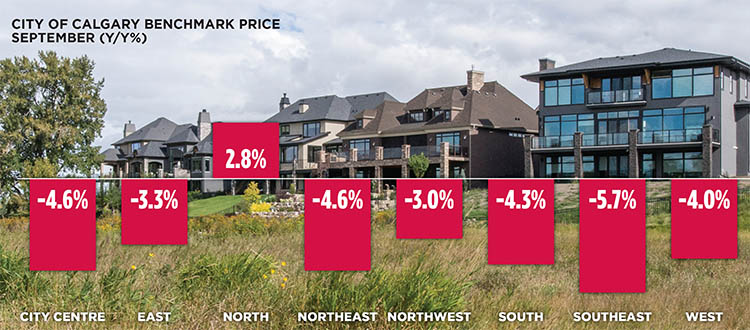
By contrast, prices were down -4.2 per cent and -1.5 per centin Calgary and Saskatoon, respectively.
CREA noted the MLS® home price index provides the best way of gauging price trends because average price trends are prone to being distorted by changes in the mix of sales activity from one month to the next.
The national average price continues to be pulled upward by sales activity in Greater Vancouver and Greater Toronto, which remain two of Canada's tightest, most active and expensive housing markets. The actual (not
seasonally adjusted) national average price for homes sold in July 2016 was $480,743, up 9.9 per cent year-over-year. If these two housing markets are excluded from calculations, the average price is a more modest $365,033 and the gain is trimmed to 7.0 per cent.
Tagged: B.C. | benchmark price | Calgary Real Estate | Calgary Real Estate News | Canadian Real Estate Association | CREA | CREA president Cliff Iverson | fraser valley | gregory klump | Home Price Index | Housing Market | lower mainland | Monthly Housing Summary | new listings | sales | Toronto | Uncategorized | Vancouver | YYCRE


Related Articles
